Portfolio Selection Based on Minimum Spanning Tree
Minimum Spanning Tree
Minimum Spanning tree is a common method to filter out complex network by maximizing the sum of correlations over connections in graph. We adopted Prim's algorithm by Peekaboo to build our network of S&P 500 stocks.
Schematising of Minimum Spanning Tree:
- 1. rank a couple of vertices(stocks) from the nearest to the farthest
- 2. draw the first edge from this rank
- 3. continue in the rank
- 4. if the new edge does not close a cycle draw it
- 5. go to point 3
- 6. stop when all the vertices have been drawn
We use the distance matrix defined as following to construct the network.
try \\( distance_{i,j} = why \\) this try \\( 1/x^{2} \\)
Portfolio Selection
We want to buld to portfolio, central portfolio and peripheral portfolio. The central portfolios and the peripheral portfolios represent two opposite sides of correlation and agglomeration. Generally speaking, central stocks play a vital role in the market and impose strong influence on other stocks, whereas the correlations between peripheral stocks are weak and contain more noise than central stocks.
To measure centrality and peripherality of nodes in MST, we define two indecie, Centrality indes and Distance index.
- Centrality index = 0.5*Degree + 0.5*Betweenness centrality
- Distance index = \frac{Ddegree + Dcorrelation + Ddistance}{3}
- Degree K, the number of neighbor nodes connected to a node. The larger the K is, the more the edges that are associated with this node
- Betweenness centrality C, reflecting the contribution of a node to the connectivity of the network. Denote V as the set of nodes in the network Distance refers to the shortest length from a node to the central node of the network. Here, three types of definitions of a central node are introduced to reduce the error caused by a single method. Therefore three types of distances are described here.
- Distance on degree criterion Ddegree, a central node is the node that has the largest degree
- Distance on correlation criterion Dcorrelation, a central node is the node with the highest value of the sum of correlation coefficients with its neighbors
- Distance on distance criterion Ddistance, a central node is the node that gives the smallest value for the mean distance
Then we pick up the stocks with the first 15 largest centrality index to make up central portfolio and the stocks with the first 15 largest distance index to build peripheral portfolio.
Applied the algorithm to stock data of 2015, the MST is displayed as following. The orange nodes in graph are the stocks in central portfolio and the green nodes are the stocks of peripheral portfolio</p>
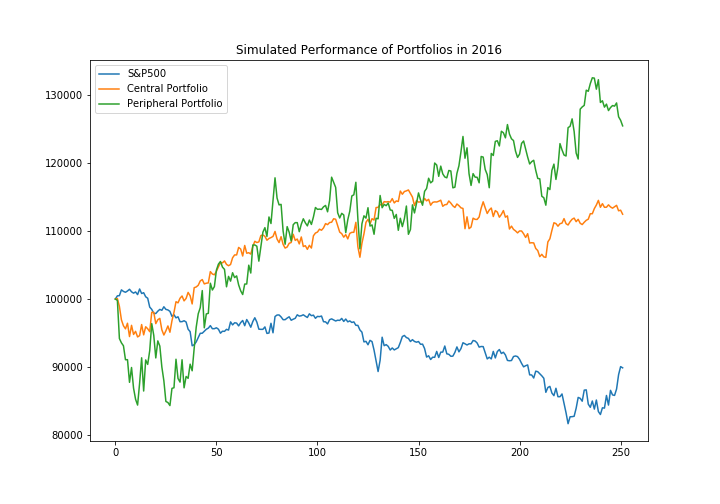
Simulation of Performance of Portfolios
Assume invest $100000 on the portfolio on 2016-01-01 and keep the portfolio for 1 year. As the figure shows, both the portfolios beat the market.