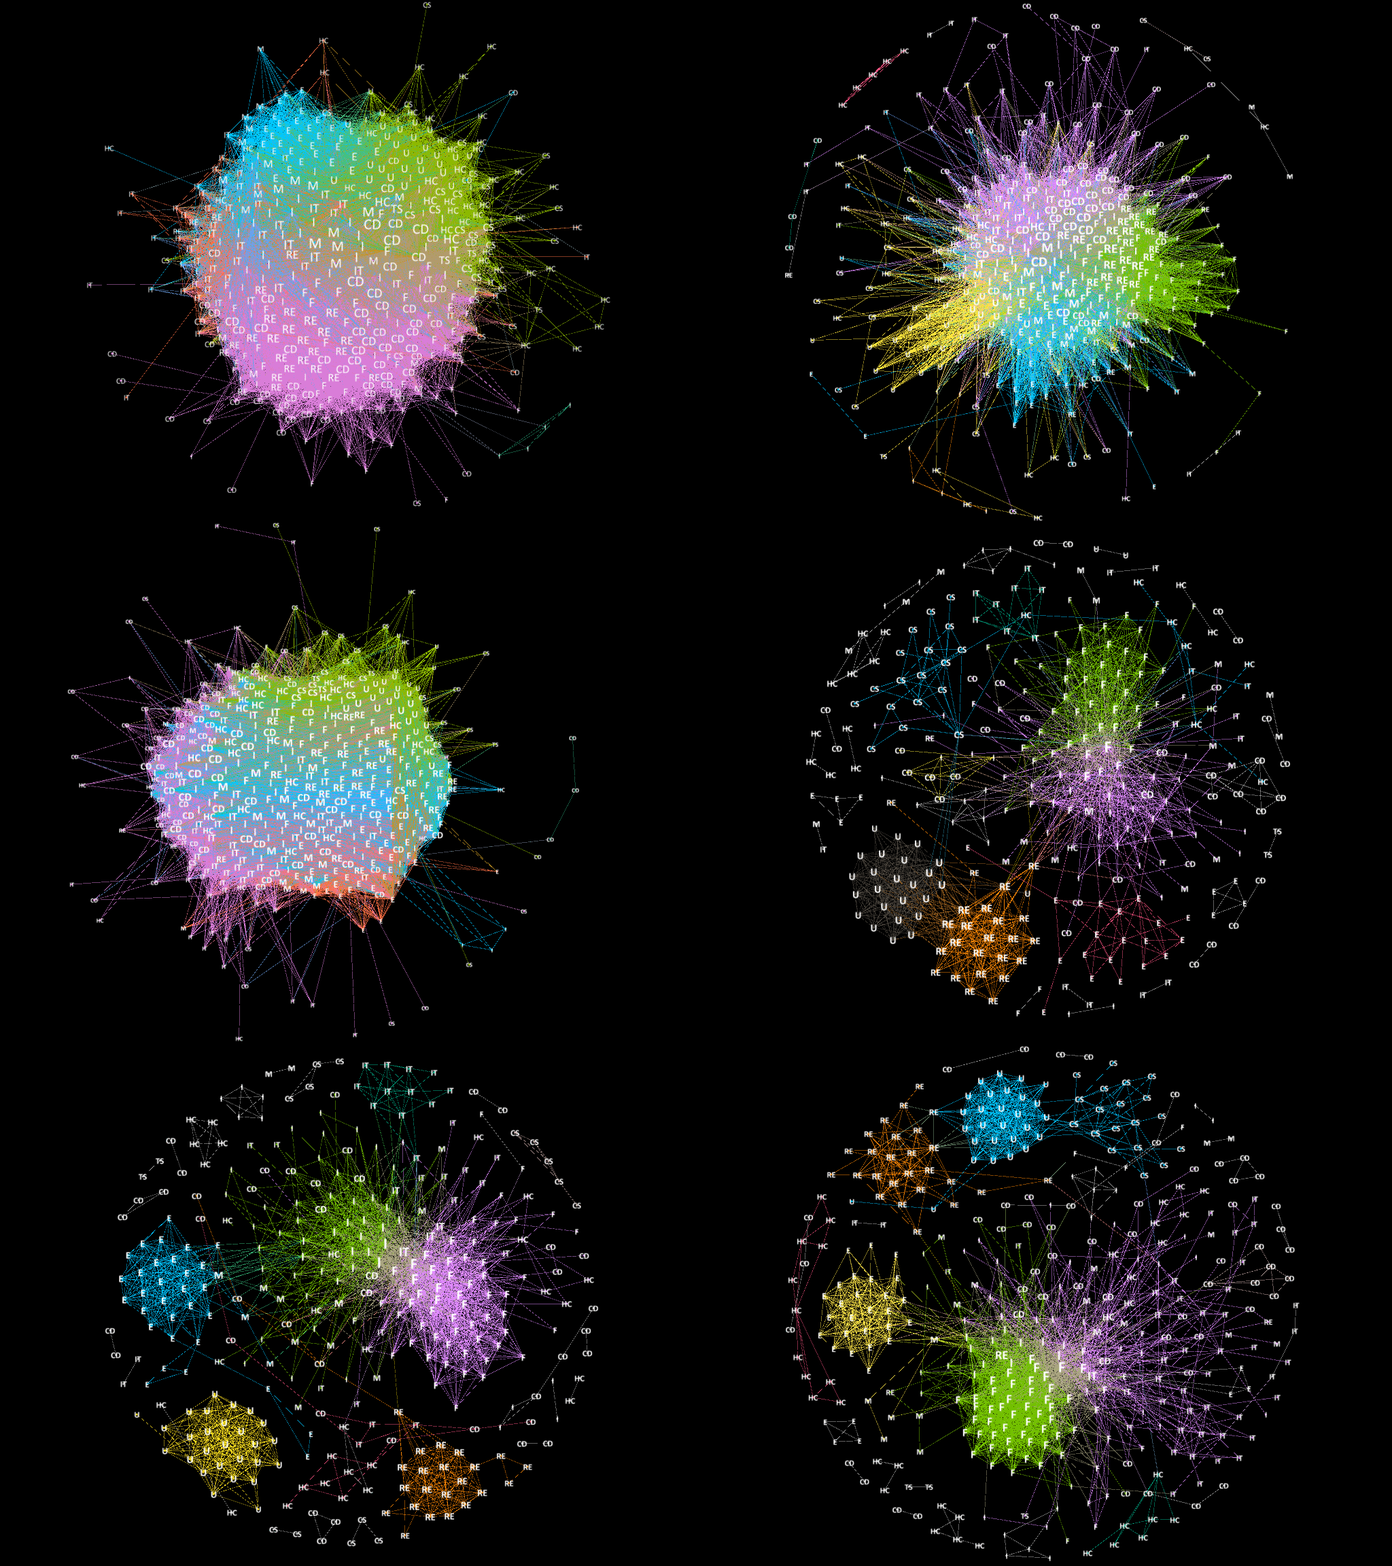
Visualization of Changes in Stock Correlations for the S&P500 dataset
By: Tongke Wu, Wenqian Li and Dayanara Lebron-Aldea
The Standard and Poor 500 is one of America’s stock market indexes based on the market capitalizations of 500 large companies. To buy a stock is to obtain a part of a corporation assets and earnings. We were interested in data from 2008-2016 to be able to capture the effect of the financial crisis on the stock market which happened in 2008, and observe how the market was recuperating after that.
Our objective was to explore the SP500 dataset by looking at the relationships between stocks and observe the behavior of the market over time. Another objective was to select a set of stocks where it would be profitable to invest in. For this project, we built a yearly networks for the S&P500 based on the correlations of different stocks returns using the open-source network analysis and visualization software Gephi. Such visualizations are useful in real practice to monitor the correlation structure of public stocks and identify key market segments in which it would be profitable to invest in. Futhermore, we used results of our network analysis to construct a portafolio and tested its performance against the entire S&P market with data from 2016.
Copyright Tongke Wu, Dayanara Lebron, Wenqian Li © 2017

